

Last updated: September 2026
Figures and program details can change – always verify current details on the official source before acting.
Key takeaways
- The national average for initial SSDI application approval in 2026 sits at approximately 36%, meaning nearly two-thirds of first-time applicants are denied.
- Geographic location significantly impacts your odds, with high-approval states like New Hampshire nearing 58% while others like Arizona fall below 35%.
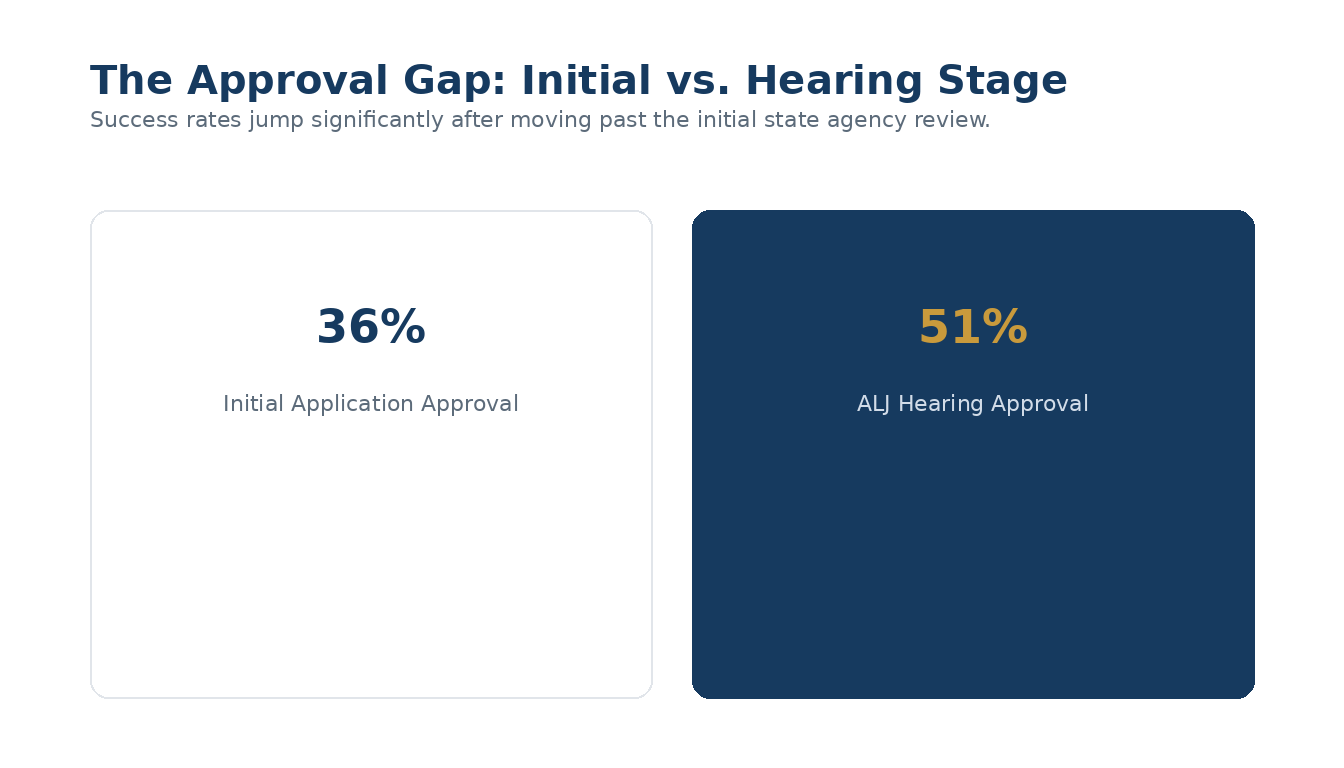
- The Administrative Law Judge (ALJ) hearing stage remains the most successful point for recovery, with national approval rates jumping to over 50%.
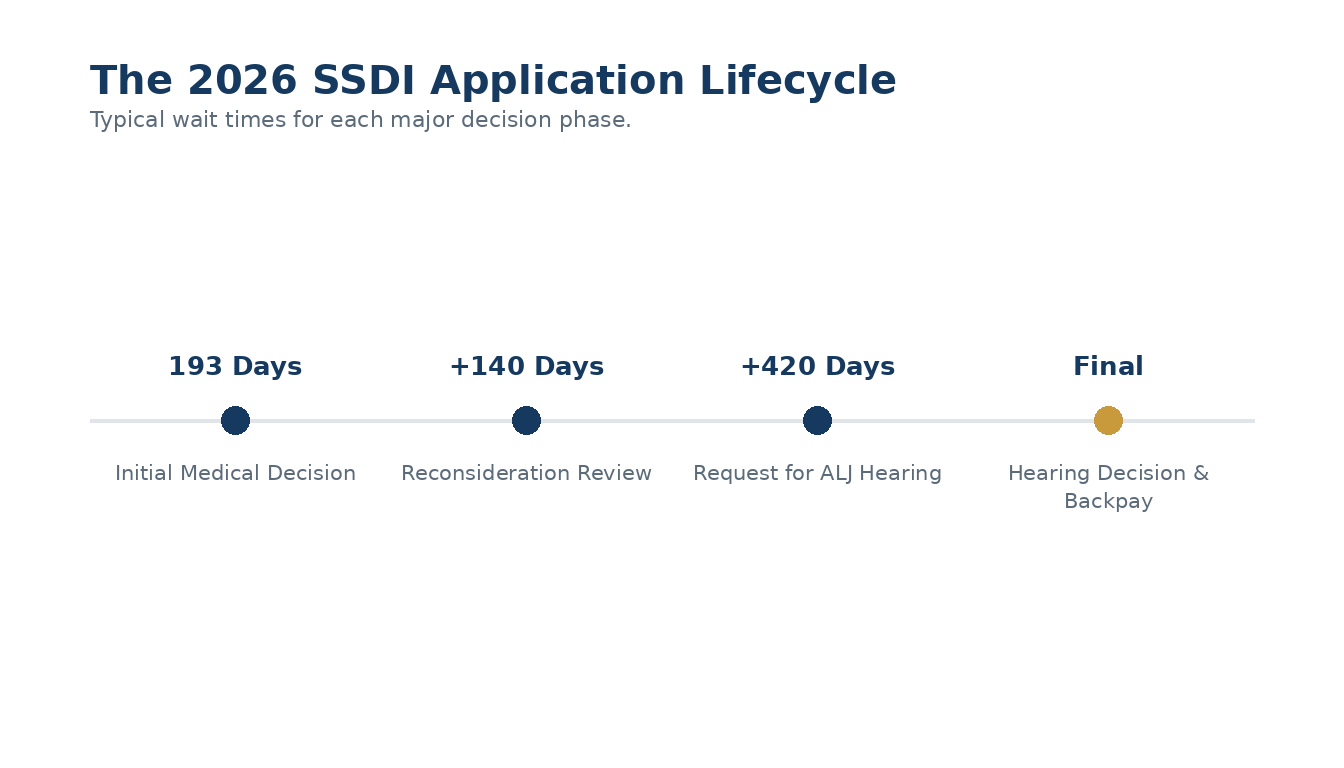
- Wait times for initial decisions have improved slightly in 2026, now averaging roughly 193 days (6-7 months) compared to longer backlogs in previous years.
Quick answer
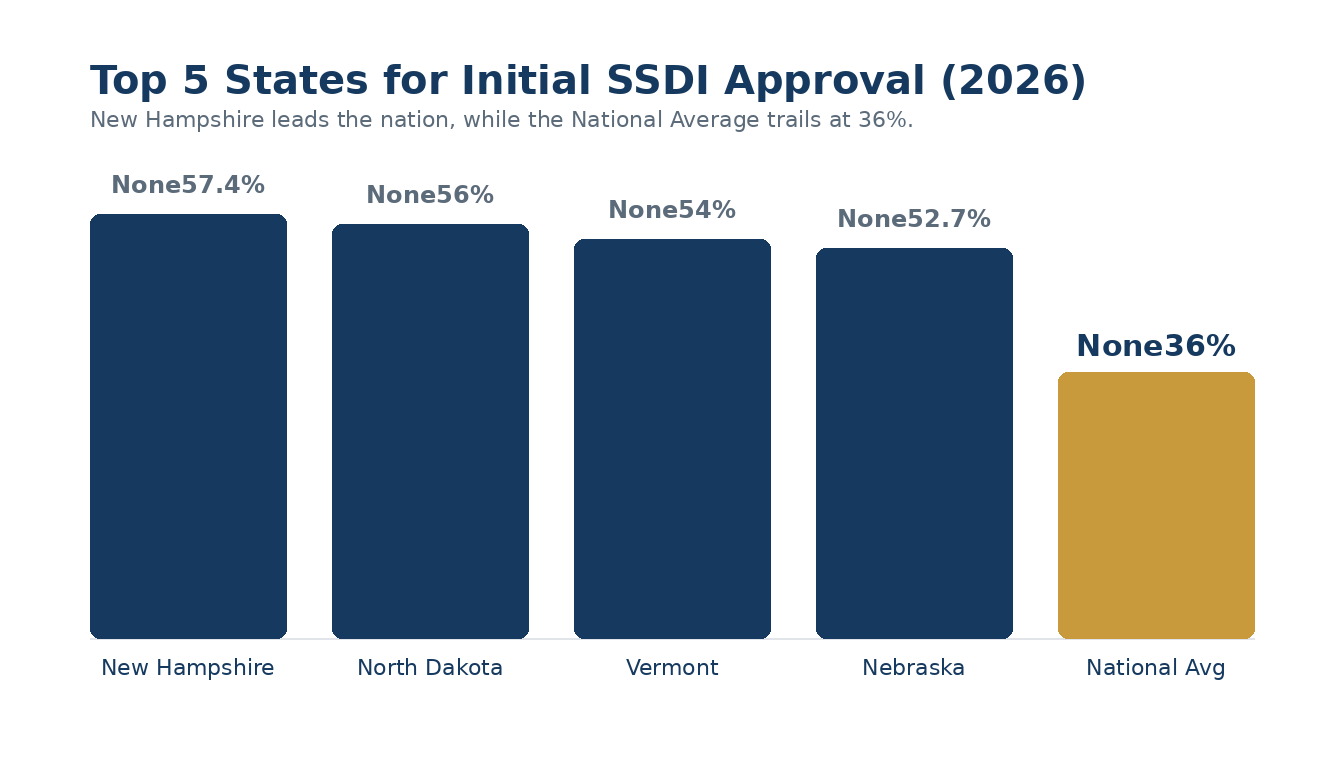
In 2026, the likelihood of your SSDI claim being approved depends heavily on the stage of the process and your home state. While the national initial approval rate is 36%, moving to the hearing level increases your chances to roughly 51-59%. New Hampshire, North Dakota, and Vermont currently lead the nation in initial approvals, while Arizona and Tennessee report some of the lowest first-stage success rates. Seeking legal representation is documented to increase hearing-level success by nearly 3x.
The 2026 SSDI Landscape: National vs. State Realities
Navigating the Social Security Disability Insurance (SSDI) system in 2026 continues to be one of the most complex financial and administrative challenges for American consumers. Despite recent efforts by the Social Security Administration (SSA) to modernize their digital systems and reduce the massive backlogs that defined the early 2020s, the “disability gap” between states remains wider than ever. This gap refers to the statistical variance in how state-run Disability Determination Services (DDS) offices interpret medical evidence and vocational factors.
While SSDI is a federal program funded by payroll taxes, the initial and reconsideration phases are managed by state agencies. This localized control means that factors such as state-level funding, the availability of specialized medical consultants, and the specific training of claims examiners can lead to drastically different outcomes for two applicants with the exact same medical condition. In 2026, we see a clear trend where northern and New England states maintain higher approval thresholds, while southern and southwestern states experience more frequent denials at the initial stage.
Understanding these figures is not just about identifying the “easiest” states; it is about preparing for the statistical reality of your specific jurisdiction. For a resident of Oklahoma or Arizona, a denial is mathematically more likely than an approval, making the appeal strategy—rather than just the initial filing—the most critical part of their recovery plan. Below is the comprehensive 2026 data comparison for all 50 states, reflecting the most recent fiscal year 2025 and 2026 workload reports from the SSA.
| State | Initial Approval Rate (2026) | Hearing Approval Rate (2026) | Avg. Initial Wait (Days) |
|---|---|---|---|
| Alabama | 42.5% | 54.1% | 215 |
| Alaska | 49.8% | 59.5% | 185 |
| Arizona | 34.8% | 48.2% | 230 |
| Arkansas | 43.9% | 53.8% | 205 |
| California | 42.5% | 52.1% | 222 |
| Colorado | 41.0% | 51.7% | 210 |
| Connecticut | 46.5% | 58.9% | 198 |
| Delaware | 44.2% | 55.4% | 202 |
| Florida | 39.6% | 51.3% | 228 |
| Georgia | 39.4% | 50.2% | 224 |
| Hawaii | 47.1% | 57.8% | 190 |
| Idaho | 45.8% | 54.9% | 208 |
| Illinois | 43.2% | 52.6% | 218 |
| Indiana | 41.5% | 53.1% | 212 |
| Iowa | 46.9% | 56.5% | 195 |
| Kansas | 48.2% | 58.1% | 192 |
| Kentucky | 40.1% | 51.9% | 220 |
| Louisiana | 39.8% | 50.6% | 226 |
| Maine | 48.7% | 59.2% | 188 |
| Maryland | 45.1% | 56.3% | 204 |
| Massachusetts | 47.8% | 58.5% | 196 |
| Michigan | 42.9% | 53.4% | 216 |
| Minnesota | 49.1% | 59.8% | 184 |
| Mississippi | 37.2% | 49.5% | 235 |
| Missouri | 41.8% | 52.4% | 214 |
| Montana | 43.5% | 54.6% | 208 |
| Nebraska | 52.7% | 61.2% | 180 |
| Nevada | 38.8% | 50.9% | 225 |
| New Hampshire | 57.4% | 65.4% | 175 |
| New Jersey | 43.3% | 55.1% | 212 |
| New Mexico | 46.2% | 54.8% | 206 |
| New York | 44.8% | 57.2% | 210 |
| North Carolina | 40.5% | 51.8% | 222 |
| North Dakota | 56.0% | 63.9% | 178 |
| Ohio | 43.1% | 53.5% | 215 |
| Oklahoma | 39.7% | 50.1% | 228 |
| Oregon | 46.4% | 56.8% | 200 |
| Pennsylvania | 44.5% | 55.6% | 208 |
| Rhode Island | 51.5% | 60.8% | 182 |
| South Carolina | 40.2% | 51.4% | 224 |
| South Dakota | 48.5% | 58.7% | 186 |
| Tennessee | 38.3% | 49.8% | 232 |
| Texas | 39.1% | 51.0% | 226 |
| Utah | 45.5% | 55.3% | 198 |
| Vermont | 54.0% | 62.7% | 180 |
| Virginia | 43.8% | 54.2% | 212 |
| Washington | 47.2% | 57.6% | 192 |
| West Virginia | 39.5% | 50.4% | 229 |
| Wisconsin | 46.8% | 56.9% | 194 |
| Wyoming | 45.2% | 54.7% | 204 |
The 5-Step Sequential Evaluation Process Explained
To understand why approval rates vary so significantly, one must first master the five-stage medical and vocational gauntlet the SSA uses to vet every claimant. In 2026, these standards are rigorously applied by state DDS examiners. The first step focuses on your current earnings. If you are earning more than the Substantial Gainful Activity (SGA) threshold—which has been adjusted for 2026 inflation—your claim will likely receive a technical denial before a doctor even sees your file.
Step two requires that your medical condition be “severe.” This means the impairment must significantly limit your physical or mental ability to perform basic work activities for at least 12 months. If the examiner believes your condition is temporary or has a minor impact on daily life, the claim ends here. By 2026, the burden of medical proof has grown, requiring more diagnostic imaging and specialist narratives than in years past.
Step three is the “Listing of Impairments,” often called the Blue Book. If your condition meets the exact medical criteria listed for a specific disease or injury, you may be automatically approved. However, most claims move to Step four, where the SSA assesses your Residual Functional Capacity (RFC). They look at what you can still do despite your limitations. Can you return to any of the jobs you’ve held in the last 15 years? If the answer is yes, you are denied.
Finally, at Step five, the SSA considers your age, education, and transferable skills to determine if there is any other work in the national economy you can perform. This is where the “Medical-Vocational Grids” come into play, often making it easier for those over 50 or 55 to be approved than younger workers. The interaction of these five steps is where the state-by-state data begins to diverge, as different regional offices apply these rules with varying degrees of strictness.
Why Reconsideration is the “Hardest” Stage to Win
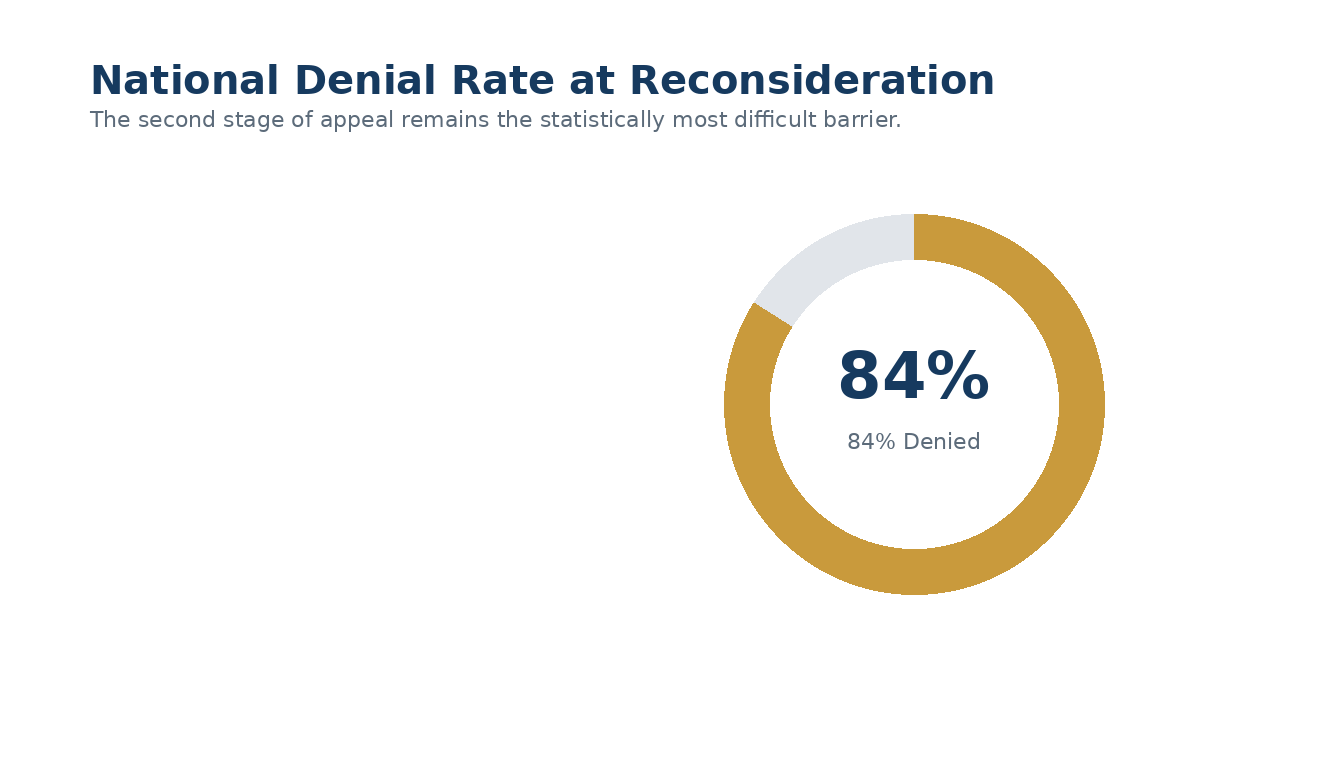
If you are part of the 64% of Americans who receive an initial denial in 2026, the next step is typically a Request for Reconsideration. Historically and statistically, this is the most discouraging phase of the entire process. Nationally, the approval rate at reconsideration hovers around a meager 16%. Essentially, a second examiner at the same state office reviews the same medical records and, in the vast majority of cases, arrives at the same conclusion.
Many applicants mistakenly view reconsideration as a “fair trial,” but in reality, it functions more like a technical sanity check of the initial denial. Unless you have submitted significant new medical evidence—such as a recent surgery, a new MRI, or a detailed statement from a treating specialist—the state office is unlikely to reverse its own decision. This creates a bottleneck that causes thousands of legitimate claimants to drop their cases out of frustration, which is precisely why understanding the data is so vital.
Despite the low success rate, reconsideration is a mandatory bridge you must cross to reach the most favorable stage: the ALJ hearing. In 2026, skipping this step means waiving your right to appeal, forcing you to start a brand-new application and losing potential months of back pay. The goal for most claimants at the reconsideration level is not necessarily to win, but to move through it efficiently to reach a judge.
The ALJ Hearing: Where the Numbers Shift
The transition from the state-level DDS office to the federal Office of Hearing Operations (OHO) marks a massive shift in a claimant’s favor. In 2026, once a case reaches an Administrative Law Judge, the approval rate national average jumps to over 50%. This is the first time in the multi-year process that you or your representative can speak directly to the decision-maker, explaining the nuances of your daily limitations that paperwork cannot capture.
ALJs have more leeway to consider “credibility” and “subjective symptoms” like pain and fatigue than the rigid automated systems at the initial stage. Furthermore, the hearing level allows for the cross-examination of Vocational Experts (VEs). A VE might testify that a person with your limitations could still work as a “document preparer,” but an experienced representative can often challenge this testimony by proving those jobs no longer exist in significant numbers or require skills you don’t possess.
By late 2026, the wait time for a hearing has stabilized in many regions to about 12 to 15 months. While this wait is grueling, the financial stakes are high. Successful hearings often result in years of retroactive back pay, covering the entire period from when your disability began to the date of the award. This is why the data consistently shows that persistence is the most valuable asset in the SSDI journey.
The Impact of Professional Representation in 2026
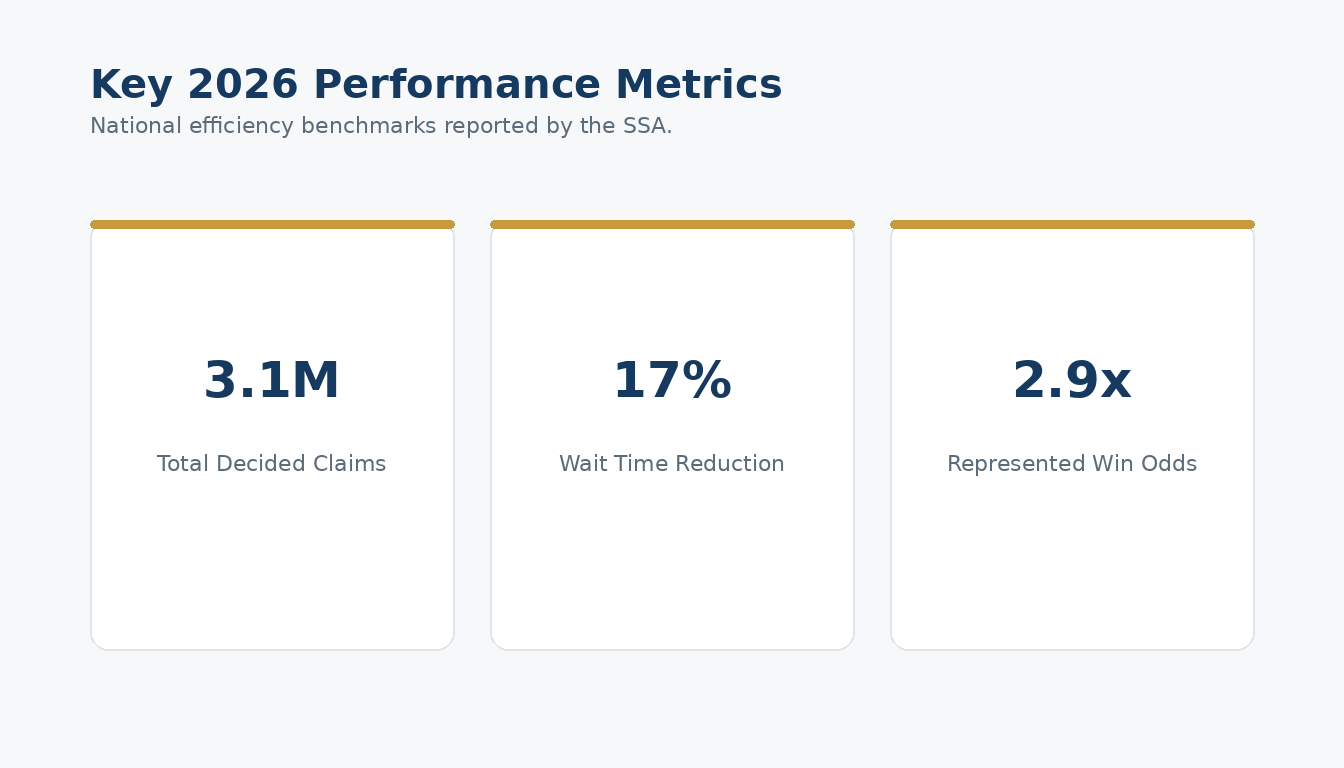
One of the most striking data points in the 2026 reports is the correlation between legal representation and success rates. Claimants who appear at a hearing with an attorney or qualified representative are nearly three times more likely to be approved than those who go it alone. The reason is rooted in the “Record Development” requirement. An attorney’s primary job is not just to talk in court, but to ensure that every single medical record from every provider has been successfully requested and entered into the SSA’s electronic folder.
In 2026, the SSA’s digital systems are faster, but they are also more prone to missing records from small clinics or rural providers. An unrepresented claimant may walk into a hearing unaware that their most critical medical evidence never reached the judge’s desk. A representative also drafts “Pre-Hearing Briefs” that map your specific medical conditions directly to the SSA’s internal regulations, essentially doing the legwork for the judge before the hearing even begins.
Financially, the risk of hiring a representative is low for most consumers. SSDI attorneys typically work on a contingency basis, meaning they only get paid if you win. Their fee is capped by federal law—usually at 25% of your back pay or a specific dollar amount set by the SSA. In 2026, this cap ensures that the vast majority of your monthly benefits and future security remain entirely yours.
Documentation Strategies for 2026 Applicants
Given the 36% initial approval rate, how can an applicant move their file into the “approved” column faster? The answer in 2026 lies in “Functional Documentation.” A common mistake is providing a stack of medical records that only list a diagnosis. The SSA does not care solely about what you have; they care about what you can’t do because of it. For example, a diagnosis of “Degenerative Disc Disease” is less important than a doctor’s note stating you cannot sit for more than 15 minutes at a time.
Utilizing Medical Source Statements (MSS) is a critical 2026 strategy. These are forms where your treating physician explicitly details your limits on lifting, standing, walking, and concentration. When a state examiner at the DDS level sees a completed MSS that aligns with your medical imaging, it becomes much harder for them to justify a denial based on their own internal algorithms. Furthermore, keeping a “symptom diary” can help you provide precise answers during the application, preventing the inconsistencies that often lead to denials for lack of credibility.
Finally, utilize the SSA’s “Compassionate Allowances” (CAL) list if you have a life-threatening or particularly severe condition. In 2026, the CAL list has expanded to include dozens of rare cancers and neurological disorders. These claims skip the standard backlog and can often be approved in as little as three weeks. Always check if your condition qualifies for expedited processing before you file your initial paperwork.
Methodology
The figures presented in this 2026 report were compiled using the Social Security Administration’s (SSA) public datasets, specifically the “Annual Statistical Report on the Social Security Disability Insurance Program” (2025/2026 editions) and the “Office of Hearing Operations (OHO) Workload Data.” State-specific initial approval rates were derived from State Agency Operations reports which track Disability Determination Services (DDS) outcomes. Processing times are based on the SSA’s “Average Processing Time for Combined Title II Disability and Title XVI Claims” through August 2026. National averages for hearings and appeals were calculated by aggregating data from the 170+ local hearing offices nationwide.
Frequently Asked Questions
Which state has the highest SSDI approval rate in 2026?
As of late 2026, New Hampshire continues to hold the highest initial approval rate in the United States at approximately 57.4%. North Dakota and Vermont follow closely behind with rates above 54%. These states typically have lower claim volumes and more favorable DDS examiner-to-claimant ratios.
How long does the average SSDI hearing take in 2026?
The total wait time from the initial denial to a hearing decision currently averages between 12 and 18 months nationally. However, once the hearing is actually held, most Administrative Law Judges issue a written decision within 30 to 60 days. Recent modernization of the SSA’s digital record systems has helped prevent some of the two-year delays common in earlier decades.
Does a high denial rate mean my state’s doctors are more strict?
Not necessarily. High denial rates in states like Arizona (34.8%) or Tennessee (38.3%) are often attributed to a combination of factors, including higher application volumes, staffing shortages in state-run DDS offices, and the specific regional interpretations of vocational guidelines by local examiners. It is a reflection of the administrative system rather than the quality of the local medical community.
Can I move to another state to increase my chances of approval?
While the data shows significant state variance, moving solely to change your jurisdiction is rarely recommended. The SSA requires proof of residency, and a sudden move during an active claim can cause significant administrative delays or trigger a technical review of your file. It is generally more effective to focus on strengthening your medical evidence within your current state.